

Cantilever Flexural Bending under Distributed Loading
This engineering simulation demonstrates the structural behaviour of a cantilevered composite profile subjected to a uniformly distributed flexural load. Using finite element analysis (FEA), engineers can predict structural deformation and longitudinal stress distribution before manufacturing begins, helping identify potential design issues early in the product development process.
Simulation Overview
- Linear static finite element analysis
- Cantilever beam configuration
- Distributed flexural loading
- Longitudinal stress (S11) contour
- Progressive deformation animation
- Engineering demonstration model
What Does This Simulation Show?
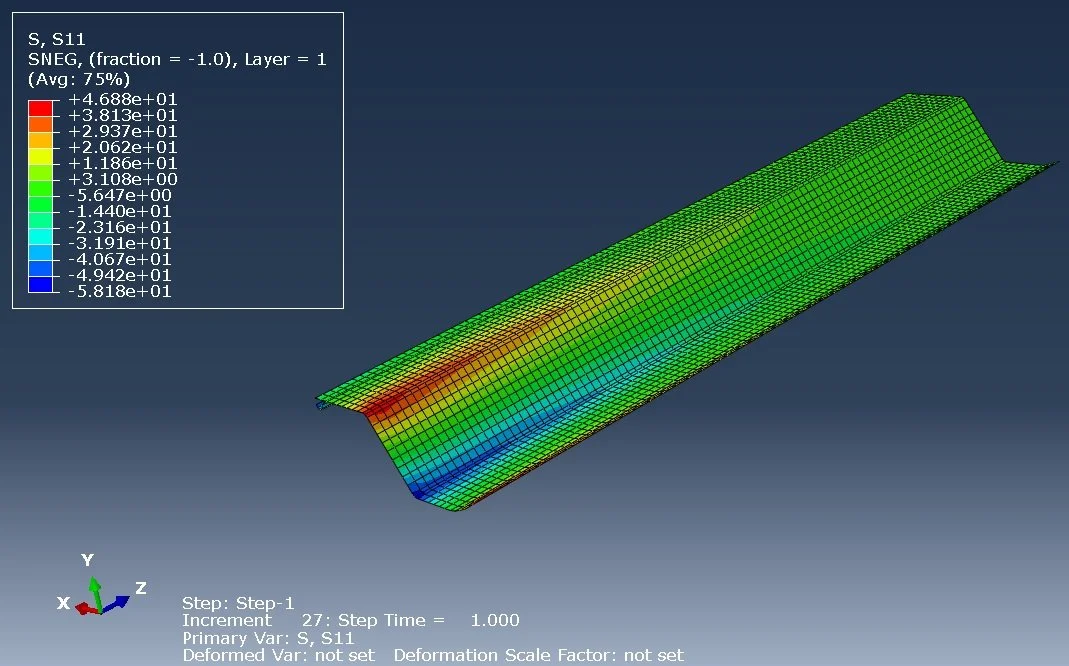
This finite element analysis (FEA) simulates the bending behaviour of a cantilevered composite structure subjected to a distributed load. The fixed support prevents movement at one end while the remaining length bends under the applied loading. As the load increases, the animation shows both the structural deformation and the longitudinal normal stress (S11) developed throughout the component. Engineers use simulations like this to understand how a product behaves before manufacturing prototypes or production tooling.
How to Interpret the Simulation
Structural Deformation
The animated movement represents the bending response of the structure. In many engineering animations the deformation is visually magnified so that structural behaviour is easier to observe.
Stress Distribution
The contour colours indicate the magnitude of longitudinal stress (S11) throughout the component. Areas with higher stress require closer engineering attention during product development.
Critical Regions
The simulation helps identify potential high-stress regions where structural optimisation, reinforcement changes or additional engineering evaluation may be required.
Understanding the Stress Colours
The colour contours provide a visual representation of the longitudinal normal stress (S11) calculated during the analysis.
Cooler colours generally represent increasing compression, while warmer colours represent increasing tension. The exact values should always be interpreted together with the numerical legend, material orientation and loading conditions.
Why Engineers Perform This Analysis
Reduce Development Risk
Identify structural issues before investing in tooling or production.
Improve Product Performance
Optimise geometry, laminate design and reinforcement layout.
Reduce Prototype Costs
Evaluate multiple design options virtually before manufacturing.
Support Better Engineering Decisions
Provide engineers with quantitative information for structural design and verification.
Engineering Applications
This type of finite element analysis is commonly used for composite tubes, pultruded profiles, carbon fibre components, FRP structural members, machine frames, ladders, platforms, aerospace structures, transportation components and many other load-bearing composite products.
Need Finite Element Analysis for Your Composite Product?
Composyne provides finite element analysis, composite structural engineering, product optimisation and engineering consulting for glass fibre, carbon fibre and advanced composite products.
Discuss Your Project